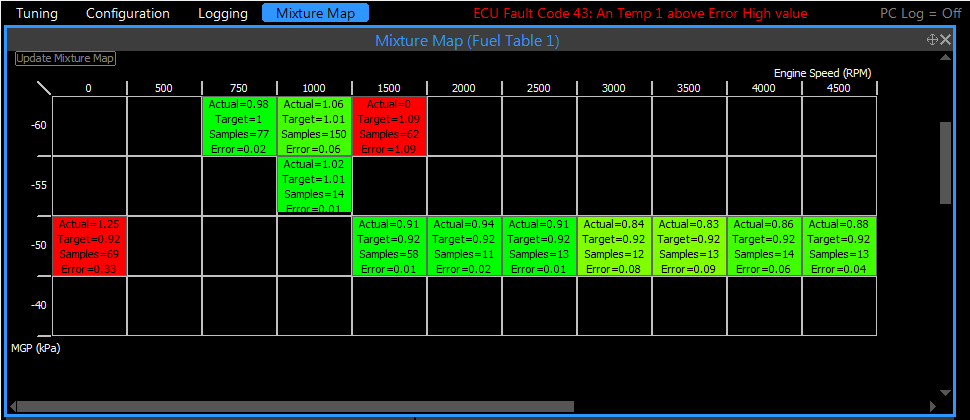
The mixture map is a tool used to help tune your fuel table based on information gathered in a log file.

Example Mixture Map
Each cell in a mixture map contains the following information:
·ACT (Actual) - this is the average of the measured samples when the engine was operating inside this cell.
·TRG (Target) - this is the target lambda/Air to Fuel Ratio (AFR) for this particular cell.
·SMP (Samples) - this is the number of samples recorded when the engine was operating inside this cell.
·ERR (Error) - this is the error between the target lambda/AFR and the measured lambda/AFR.
The cell colour provides important information:
·A lush green colour represents low error.
·A deep red colour represents high error.
·There is a 8 step colour gradient between these two colours. e.g. a yellow colour represents a mid error.
·A sky blue colour shows the cell has been used to make a correction to the fuel table.
The AFR/Lambda range that the colours represent is defined by the Highlight Range setting.
The mixture map can be re-calculated at any time by right clicking and selecting Update Mixture Map or clicking the 'Update Mixture Map' text at the top left of the window. Note that the blue cell markings will be cleared.
Corrective changes can be applied to the fuel table by double clicking a cell, the mixture map will calculate the correction automatically. Alternatively you can right click and select Correct Fuel Table.
The steps below are a guide on how to use Mixture Map.
1.Open Mixture Map by Clicking Tuning > Mixture Map 2.Setup the Mixture Map - Properties window. If you unsure on the settings to use refer to the 'Setting up Mixture Map' section below. Click OK. 3.Press F8 to start recording a PC Log, move through the different cells in the fuel table by altering the engines RPM and load. 4.Press F8 again to stop the PC Log recording. Click 'Update Mixture Map' at the top left corner of the window. 5.The cells in the Mixture Map window that contain recorded data from the log will now display in a range of colours from green to red. 6.To have Mixture Map correct the fuel table in a certain area, double click a coloured cell in the Mixture Map. Proceed with all the cells you wish to change. 7.Open the fuel table and check that Mixture Map has correctly applied the changes to the corresponding cells.
Tuning Notes
·Use Mixture Map to tune a section of the fuel table at a time, maybe one or two rows or columns. ·Once Mixture Map has a tuned a section of the fuel table it is recommended to repeat the process in the same section so that the new difference between the actual and target lambda/AFR can be checked. ·If you get no data upon clicking 'Update Mixture Map' check the properties of the Mixture Map. Also check the PC Logging settings to make sure the required data is being recorded. ·Remember to do a Store (F4) to save the changes to the ECU. |
Setting up the mixture map correctly will provide excellent tuning results, where as a poor setup may not.
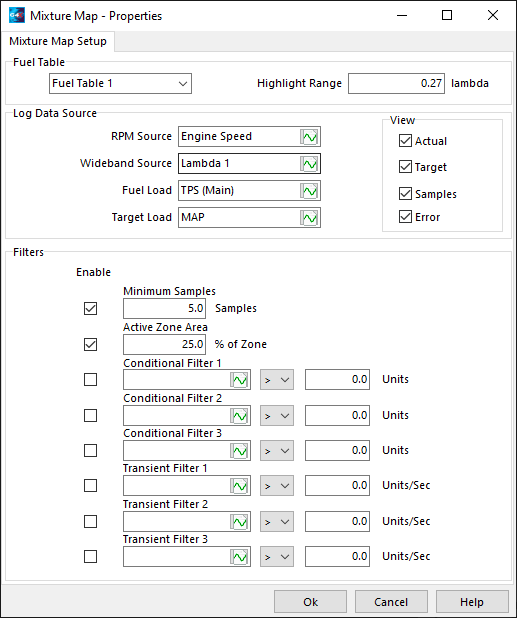
 An example mixture map setup window To setup a mixture map the following conditions need to be met. ·Either an ECU must be connected or a configuration file open. ·A log file must be open. ·Both the AFR/Lambda Target table and the Fuel Table must have an x and a y axis.
Once the above conditions have been met you will need to define the following: ·Fuel Table - select the fuel Table to be tuned. ·Highlight Range - the AFR/Lambda range to span the cell colours across. ·RPM Source - select the log files RPM channel. ·Wideband Source - select the wideband channel where the mixture map can get lambda/AFR data from. ·Fuel Load Source - select the log files fuel load source - this must match the selected fuel table. ·Target Load Source - select the log files target load source - this must match the lambda/AFR target table.
On completion of selecting these channels you may generate a mixture map, however improvements can be made to the mixture map by enabling some filters.
The following filters are provided: ·Minimum Samples - enabling this filter allows you to specify the minimum amount of samples required before the cell will be populated with information. ·Active Zone Area - this filter discards samples outside the specified percentage around the zone centre. E.g. if this was set to 50%, the samples will only be considered if they fall within 50 percent of the distance from the cell centre to any cell edge. ·Condition Filters - a conditional filter allows you to discard samples based on whether another logged parameter is below or above a predefined value. E.g. TPS > 15 - this means that samples will only be included if the TPS is greater than 15%. ·Transient Filters - a transient filter allows you to discard samples based on the change in another logged parameter. E.g. TPS < 50% - this means that samples will be included if TPS is changing at a rate less than 50% per second. Note: Filter settings can be stored, but not applied by leaving the enable checkbox unchecked.
Control over what is displayed in the mixture map can be adjusted by the checkboxes relating to the four different data items: ·Actual ·Target ·Samples ·Error |


