Graphing provides a powerful visual representation of 2D and 3D tables. This section provides an outline of the two and three dimensional graphs available.
Any active table can be viewed as a graph by:
·Pressing keyboard shortcut K
·Selecting 'Show Table Graph' in the right mouse button popup menu.
·Pressing the Table Graph Icon ![]()
You can force a table to open by shift + clicking on it in the ECU Settings menu on the left.
Shift + F and Shift + I force new fuel and ignition tables to open, even if these tables already exist in the layout page.
Table graphs maintain all table functions except snake trail. The user can click on cells then use standard table tuning functions to interpolate, increase/decrease, copy paste and select cells.
A list of table keyboard shortcuts can be found under Keyboard Shortcuts.
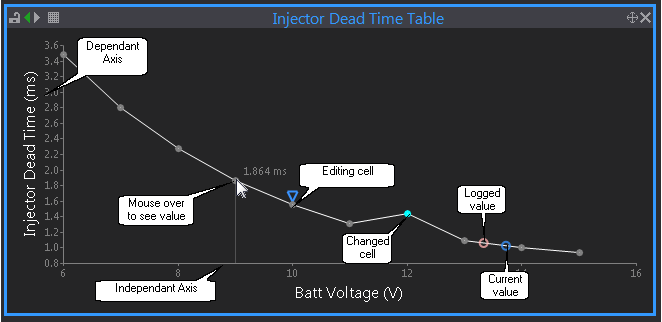
A 2D graph is displayed only for 2D table. (e.g., RPM Limit, Crank Enrichment or Trigger Arming Voltages).
The editing cell is represented as an upside down triangle, the user can select cells by clicking on them directly, or clicking and dragging over a group. Hovering the mouse over a cell will reveal its exact value.
2D table graph cells can be dragged up and down with the left mouse button.
Crosshairs are displayed as circles.

2D Table Graph
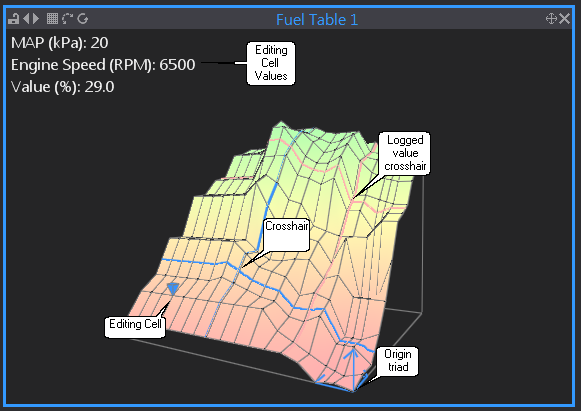
A 3D Surface graph is suited for viewing a 3D table. (e.g., Fuel Map, Ignition Map or Trigger Arming Voltages).
Cells are displayed where two lines meet (see editing cell below)

3D Surface Plot of a Table
Except for the snake trail, all existing table functions work on the surface graph of a table. The user can edit cell values just like a grid table. By default keyboard arrow keys move the editing cell selection, by pressing '\' the arrow keys change functionality and now rotate the surface.
Left mouse click on an intersection on the surface plot selects a cell, clicking and dragging selects a group. This will make the selection become the editing cell in the on the table. The surface can be navigated with the mouse, mouse movement while the right mouse button is pressed and held rotates the surface. The surface can be zoomed with the scroll function on the mouse.


