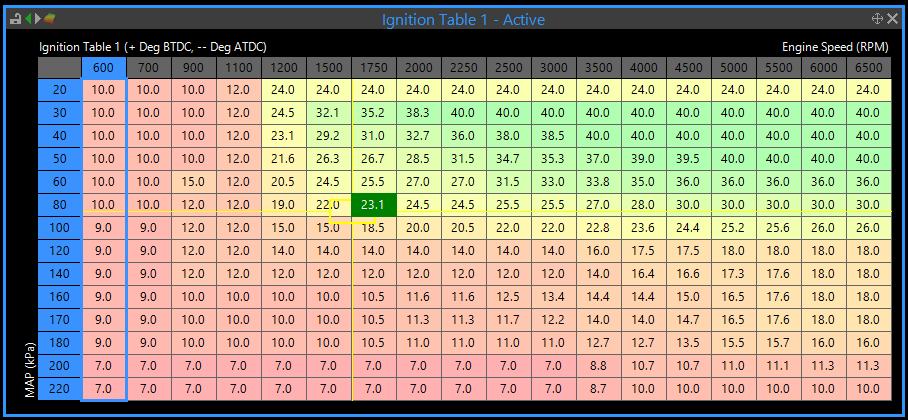
PCLink tables are used to edit ECU Maps. The following image shows an example ignition table.
Table Features
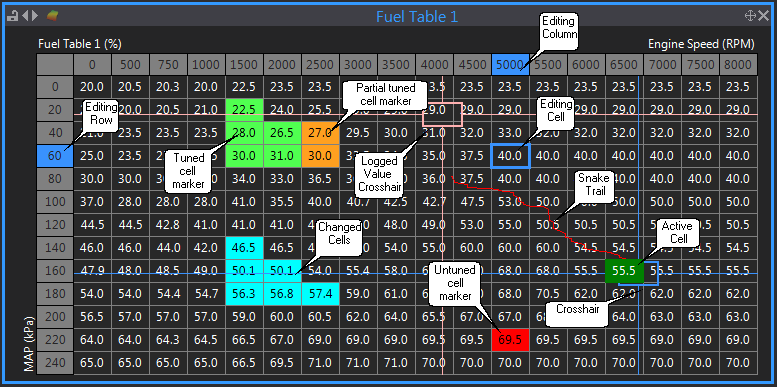
Click on features in the table pictures for help on that feature.

Table Features
These are the parameter values that each row and column is centred at.These can be altered by right clicking on the table and selecting Axis Setup or by pressing the X key. Note that not all tables have configurable rows and columns.
The cross hairs show exactly where in the table the engine is operating. When the cross hairs are exactly in the centre of a cell, then the value used by the ECU is the number in that cell.
The snake trail shows exactly where in the table you have been. The snake trail holds a fixed number of samples and will erase its tail to avoid drawing all over the table. The snake trail can be paused or turned on/off using the F6 key.
The active cell is the cell in the table that currently has the most influence. It is the cell that the cross hairs are currently closest to the centre of. Note that the actual value used from the table is interpolated when the cross hair is between cells.
The editing cell is the cell that you want to change. Its value can be changed by simply typing a new value or using the Q, A, Page Up or Page Down keys. The currently selected row and column are highlighted in the row and column labels. The editing cell can be moved by clicking or using the arrow keys. The cells currently being edited are surrounding by a bounding rectangle. Normally only one cell is selected for editing but the selection size can be changed by holding SHIFT and clicking, or using the arrow keys. Once multiple cells are selected they can be altered as a single block. This is an extremely powerful feature and can reduce the time required to tune tables. Single cell and block editing functions include:
·Change block to value (just type in a new value).
·Maths functions (add, subtract, multiply, divide, alter by percentage).
·Copy the block up, down, left, right (Ctrl + arrows).
·Fill left, right, up and down to end of row/column (Ctrl + F to fill right).
·Interpolation (Ctrl + I) and extrapolation.
·Copy/Paste (Ctrl + C, Ctrl + P).
To select an entire row, click on the row label on the left. To select an entire column, click on the column label at the top. To select the entire table, click the area at the top left of the row and column labels.
Active cell tracking can be enabled to allow the editing cell to automatically follow the active cell. Press the SPACE key to jump the editing cell to the active cell.
The logged value cross hairs will be visible if a log file is open. They relate to the currently selected log file. They show the position in the table at the current time in the log file. Moving the log cursor to see where in the table the engine was operating at that point in the log. Some important points about the logged value cross hairs:
·The connected ECU or open file must match the ECU that the log file came from.
·The log file must contain samples for the parameters used on the axis of the table (eg if a table uses RPM/MAP then the RPM and MAP must have been logged.
Cells can be marked in a variety of ways. Each way suits a particular tuning purpose. The colours used to mark cells can be configured in Options->Colour Theme. Available markers are:
·Runtime Marker (Marker Colour, Red default) - This marker is used to tag a particular cell for future reference at runtime. For example, it may be used during a road test or dyno pull to tag where a misfire occurs. Press the B key to place runtime marker. The runtime marker will be placed at the current active cell position. Note that a marker will also be placed in the log file if PC logging is currently recording. The N key can be used to add/remove in individual runtime marker in a table.
·Changed Cell Marker (Value Changed Colour, Aqua default) - This is used to indicate that the value of a cell has been changed from its original value.
·Part Tuned Marker - Use this marker to indicate that a cell has been tuned but perhaps not to is exact final value. Press the Y key to place/remove a part tuned marker. Note that Quick Tune also places these markers during automated tuning.
·Tuned Marker - Use this marker to indicate that a cell has been completely tuned to its final value. Press the Z key to place/remove a tuned marker. Note that Quick Tune also places these markers during automated tuning. Once a cell is marked as tuned Quick Tune will not try to retune it. This can be used to prevent quick tune from attempting to change cells you are already happy with.
To clear the markers on a table, select the table and press Shift + M. Or right click on the table, select Cell Markers->Clear Tuning Table Markers.
To clear all markers on ALL tables, press the F9 key or select Tuning ->Reset Markers or right click on the table, select Cell Markers->Clear All Table Markers.
To determine what markers apply to a particular cell, right click on the cell and select Cell Markers. The appropriate markers will have a check mark beside them.
Even though a cell may have more than one marker, it will only be coloured with the highest priority marker. The order of priority is Runtime Marker (Highest), Tuned, Part Tuned, Changed (Lowest).
Keyboard Shortcuts
Nearly all table features can be operated from the keyboard, for a complete list of table editing keys, refer to the Keyboard Shortcuts.
Tables have special functions that speed up tuning time. To access these functions right click on the table.
Colour Gradient Map Press the H key to toggle colour gradient mode. Note that the colours used for the gradient map can be configured in Options->Colour Theme. The theme colours used are Gradient Low, Gradient Middle and Gradient High.  Table Example - Ignition Table 1 Coloured
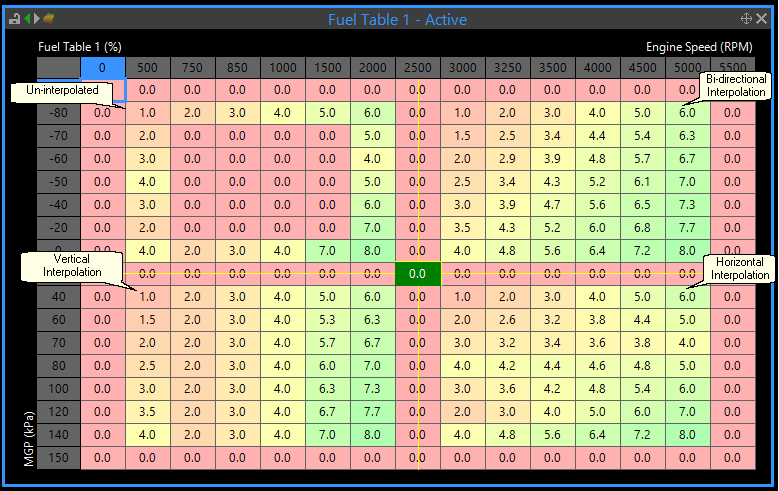
Interpolation Interpolation can either be performed vertically, horizontally or bi-directionally. Interpolation means adjust the values between the edges of selection to make a straight line, the edges used depends on the interpolation type.  Interpolation Examples
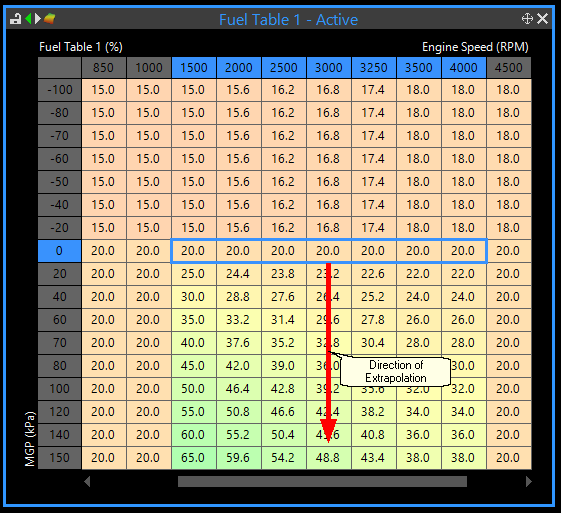
Extrapolation Extrapolation is used to continue an existing trend in one direction. If you select a row of cells, and select extrapolate down, the cells below will follow the same slope as the one between the selection and the immediate cell above. The following example illustrates this:  Extrapolation Example You can also extrapolate in the other three directions. |


