


·Setting up a Target Gauges Runtime Values
A target gauge is useful for comparing two parameters, usually a target and a measured value.
Target Gauge Key Features:
·The size of the bar is proportional to the error between the two parameters.
·To change which parameter is at the top of the gauge, shuffle the parameters inside the Runtime Values Setup window.
The following image shows an example target gauge.

Target Gauge
To create a target gauge:
·Click Views > Target Gauge in the main menu or
·Use the shortcut CTRL+F9 or
·Right Click in open space > Select New View > Select Target Gauge
Next:
·Add parameters to the gauge by either:
·Double Clicking the gauge,
·Right clicking and selecting Properties or
·Drag and Drop a parameter from the Parameters Menu.
Setting up a Target Gauges Runtime Values
The gauge setup can be accessed by right clicking on the view and selecting Properties. Select the Runtime Values tab. The following image shows a typical runtime value setup window.

Runtime Values Setup Window
Visibility Groups
Parameters can be added to gauges in visibility groups. Visibility groups are based on tables, each group can have a parameters added to it. When a table becomes active, the parameters inside the corresponding group become visible. The Always Visible group contains parameters that are always visible.
Visible Parameters
Parameters with a green icon are present in the connected ECU. Parameters with a grey icon can be added, but they are not currently being received from the ECU.

Storm DI Frequency availability
Adding Visibility Groups
Visibility groups can be added by selecting the Table Groups tab. A tree view will become visible containing all of the 3D tables. Double clicking the group or selecting the group and clicking the arrow button to transfer the group into the list.
Notes
·Each parameter can only be included in one group at a time.
·If the current active table relates to a group that has not been added as a viability group, the Always Visible group will become active.
·In the case of a gauge or view that can take more than one parameter, parameters inside the visibility group corresponding to the currently active table will be displayed as well as the Always Visible group parameters.
·Delete groups by clicking the red cross button underneath the groups list. The selected group will be deleted. Note that the Always Visible group can not be deleted.
Adding Visible Parameters
To add parameters first select the visibility group that you wish to add parameters to. With the Parameters tab selected click on the parameter in the tree view that you wish to add. Click the arrow and the selected parameter will be added (or double click the parameter).
Multiple parameters can be added together by either:
·Selecting a heading in the tree view and clicking the arrow. This will add all the child parameters of this heading until the list becomes full.
·Select a group of parameters by clicking on the first parameter, hold SHIFT and click on another parameter. These two parameters will become selected as well as all of the parameters between. Click the arrow to add the parameters to the list.
·Select multiple individual parameters by holding down CTRL and clicking on each parameter. With the required parameters now selected, click the arrow to add the parameters to the list.
Notes
·Shuffle parameters around the list using the up and down arrow buttons. Select parameters using SHIFT and CTRL keys to move multiple parameters.
·Delete parameters by clicking the red cross button underneath the visible parameters list. Select parameters using SHIFT and CTRL keys to delete multiple parameters.
·You can add an entire group by selecting it and clicking the add button.
The gauge setup can be accessed by right clicking on a gauge and selecting Properties. Select the Gauge Setup tab. The following image shows a typical gauge setup window and the produced gauge.
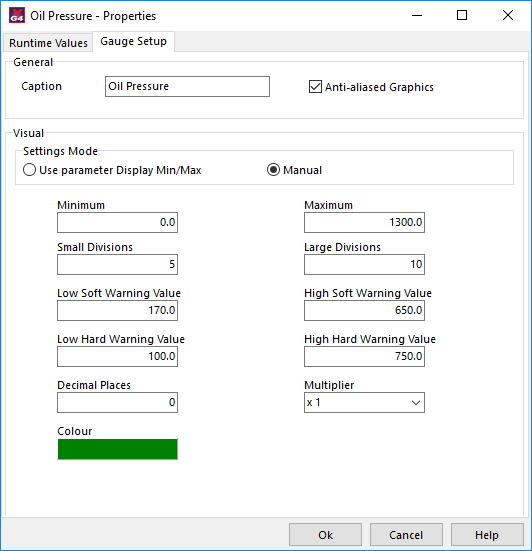
Gauge settings are categorized under general settings and visual settings. Not all settings are available on all gauges.
·General
·Caption - The caption is the name displayed in the title bar of the gauge panel.
·Anti-aliased Graphics - Select this option to generate a gauge of higher graphical quality. On older PCs this may slow down PCLink.
·Visual Settings
·Settings Mode
·Use Parameter Display Min/Max - Gauges visual properties are controlled by the global ECU Parameters menu.
·Manual - The visual properties of the gauge are controlled manually by this window.
·Minimum - Minimum specifies the minimum value on the gauge. If the parameter goes below this value the gauge position will remain at the minimum.
·Maximum - Maximum specifies the maximum value on the gauge. If the parameter goes above this value the gauge position will remain at the maximum.
·Small Divisions - Small divisions controls the number of short ticks between the large ticks. If small divisions was set to 1, no small ticks would be displayed as there is only one division between the large ticks. Small divisions must be set to a number from 1 to 10.
·Large Divisions - Large divisions controls the number of large ticks on the gauge. If large divisions was set to 5, minimum was set to 0 and maximum was set to 500, the gauge would have large ticks at 0, 100, 200, 300, 400 and 500. Large ticks must be set to a number between 1 and 20.
Low and High Soft and Hard Warning Value colour is set in the Colour Themes Window.
·Low Soft Warning Value - Specifies the starting value of where ticks will begin to be drawn in the prescribed colour value towards minimum. If this was set to 25, minimum was set to 0 and maximum was set to 100, the gauge would have ticks from 0 to 25 in the appropriate colour. To have no low soft warning value, set the value equal to or less than minimum.
·High Soft Warning Value - Specifies the starting value of where ticks will begin to be drawn in the prescribed colour towards maximum. If this was set to 75, minimum was set to 0 and maximum was set to 100, the gauge would have ticks from 75 to 100 in the appropriate colour. To have no high soft warning value, set the value equal to or greater than maximum.
·Low Hard Warning Value - Specifies the starting value of where ticks will begin to be drawn in the prescribed colour towards minimum. If this was set to 25, minimum was set to 0 and maximum was set to 100, the gauge would have ticks from 0 to 25 in the appropriate colour. To have no low hard warning value, set the value equal to or less than minimum.
·Low Hard Warning Value - Specifies the starting value of where ticks will begin to be drawn in the prescribed colour towards minimum. These ticks are drawn over top of soft warning ticks. If Low Hard Warning Value was set to 10, Low Soft Warning Value was set to 25, minimum was set to 0 and maximum was set to 100, the gauge would have Low Soft Warning ticks from 25 through to 10, then Low Hard Warning from 10 to 0. To have no low red line, set the value equal to or less than minimum.
·High Hard Warning Value - Specifies the starting value of where ticks will begin to be drawn in the prescribed colour towards maximum. These ticks are drawn over top of soft warning ticks. If High Hard Warning was set to 90, High Soft Warning set to 75, minimum 0 and maximum 100, the gauge would have High Soft Warning ticks from 75 through to 90 then High Hard Warning Ticks from 90 to 100.
·Decimal Places - The decimal places property specifies the number of decimal places that will displayed on the gauge. If decimal places was set to 1, and the current value was 90, the value displayed would be 90.0.
·Multiplier - The multiplier allows you to apply division/multiplication to the parameters units value. Options include /100, /10, x1, x10, x100, x1000. If the current value was 3500RPM and a multiplier was set to x100 the following would be displayed on the gauge 35 RPMx100. Ticks would be marked with 30, 40, 50... etc (depending on other settings).
·Colour - The colour property allows you to change the colour theme applied to each gauge. Colours help the user quickly identify individual gauges on a page.