


The Parameters pop out menu lets you edit the configuration of the runtime parameter properties. The menu is located down the left hand side of the screen, click the 'Parameters' tab or press 'Ctrl + E' to pop this menu out and press 'Esc' to close it. This menu can also be found under the 'View' tab at the top of the screen.
The following screenshot shows you a typical Parameters menu.

Parameter Setup Panel
Parameter configurations can be saved and opened using the disk and file icons at the top right of the parameter window.
Parameters can be "Dragged and Dropped" onto gauges. Eg to make a dial gauge show Engine Speed, drag the Engine Speed parameter (found under Triggers), and drop it onto the gauge.
The gauge's move lock has to be off for this to work.
Properties of each parameter can be accessed by right clicking them and selecting Properties, or double clicking on the parameter.
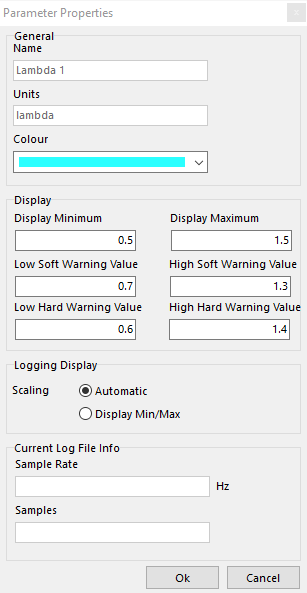
Name cannot be edited, units are shown depending on settings in the Units tab of the Options Window.
Colour can be selected from a list of colours defined in the Parameters section of the Colour Theme Window.
Each parameter has its own properties, when the parameter is logged or displayed on a gauge these properties will be used.
When a parameter is displayed on a gauge the Display properties set above will be used to set up the gauge. Display Minimum and Maximum will be the range shown, Low and High Soft Warning Value is when the gauge will begin to show the "Soft Warning Colour" (usually orange), similarly, low and high Hard Warning values indicate when the display will show the "Hard Warning Colour" (usually red). See Colour Themes for details.
For the Oil Pressure parameter shown above:

Normal

Hard Warning
Note: If a warning is not wanted, the soft and/or hard warning values can be set above or below the display minimum or maximum (see Engine Speed parameter properties for an example)
Logging Display
While logging, or reviewing a log file, these settings will determine how the parameter is scaled. If scaling is set to automatic, then the axis of logging views will be determined by whatever the minimum and maximum values are, a small buffer is added to each end to help center the plot. For example, if a log file has Engine Speed, and the highest engine speed logged was 7800 rpm, then the time plot will scale to about 8500.
If you change the Scaling to Display Min/Max then the Display Minimum and Display Maximum values above will be used.
Current Log File Info
This shows the current sample rate and number of samples for this parameter for the currently selected log file (blank if there is no log file).