·Adding Parameters to the Time Plot
The time plot allows you to view logged data over a time period. The following example shows a typical time plot.
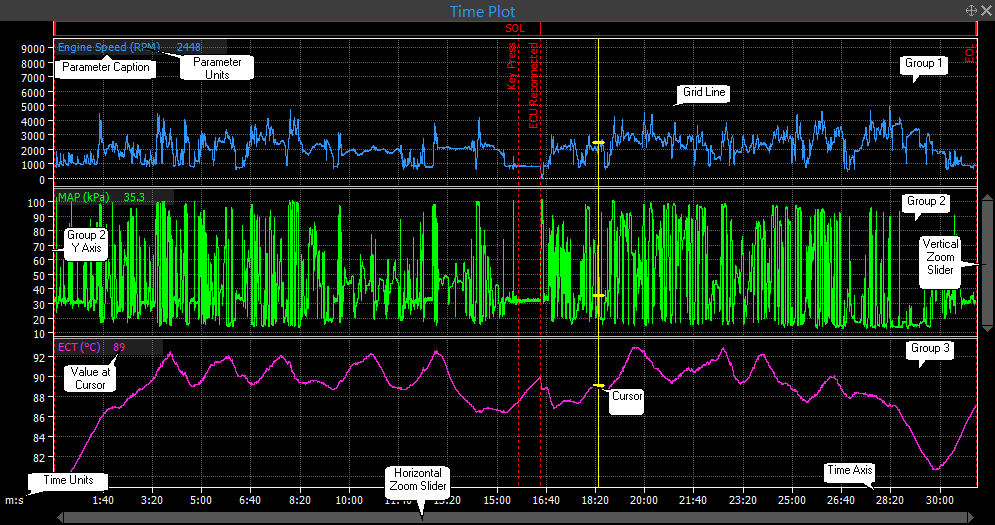
Time Plot Example - Grouped Mode
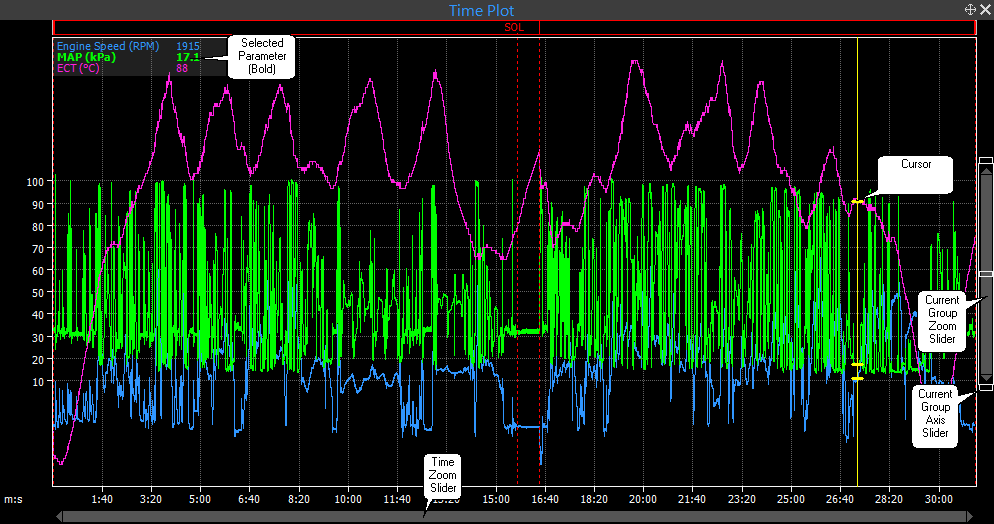
Time Plot Example - Overlay Mode
To create a Time Plot:
·Click Logging > Time Plot in the menu or
·Right Click in open space > Select New View > Select Time Plot
Adding Parameters to the Time Plot
To add parameters to the view, right click select 'Properties'. The following dialog will appear:
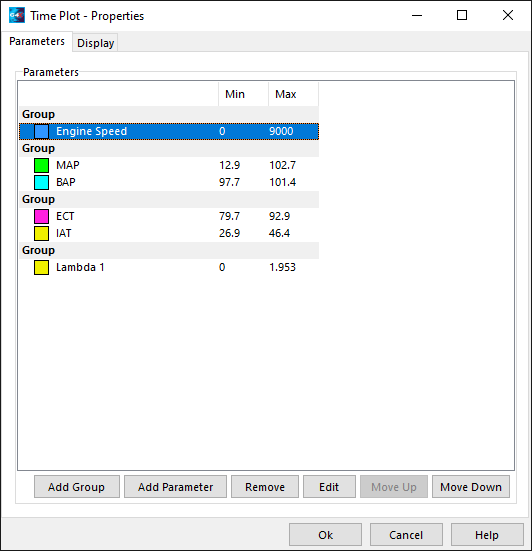
Setup Window
From this window parameters and groups can be added. Parameters can also be removed or edited. Click either 'Add Group' or 'Add Parameter', the following selection form will appear. 'Add Group' isn't available for all Views.
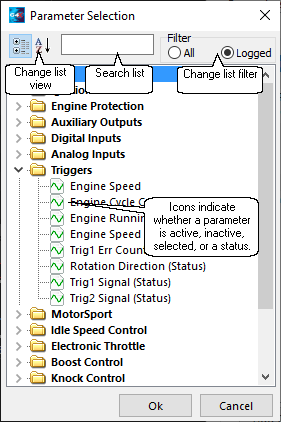
Select Parameter Window
Click or search for the required parameter. Multiple parameters can be selected using the Shift and Ctrl keys, entire categories may be selected. Click OK to add the parameter to the view. Note: When searching or viewing logged parameters, icons indicate whether a parameter has data in the current log file.
Here the user has searched 'eng', the list is displayed alphabetically, and the icons now indicate whether the parameter has data in the current log file.
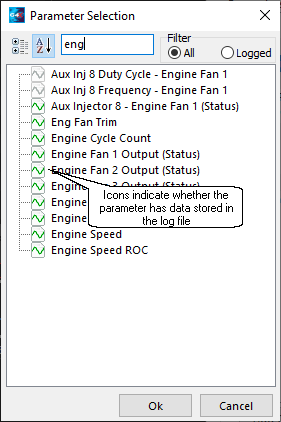
Select Parameter Window - Search
The user can also search the logged parameters for a specific parameter, here the icons will always be green.
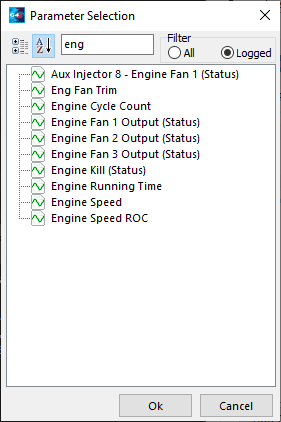
Select Parameter Window - Logged Search
The time plot can be driven using both the keyboard and the mouse.
Using the Cursor
The cursor is a vertical line representing the current point in time. At any stage, the parameter values at the cursors position in time can be read from the plot's Legend.
·The cursor can be moved with the mouse. To do this, click the location on the plot where you want the cursor to move to.
·The cursor can be moved with the keyboard (the plot must be the focused view). To do this, press the left and right arrow keys to move the cursor. Hold ctrl and then press the arrow keys to move faster.
Horizontal Zooming and Navigation
The plot can be zoomed and navigated in the horizontal direction. The current zoom and navigation position is represented at the bottom of the plot by a zoom slider.
·The plot can be horizontally zoomed by the mouse in two ways:
·Double click the section of the plot where you want the start of the zoom area, move the mouse and you will see a highlighted area - this is the new zoom area. When the desired zoom area has been selected, left click once to zoom in on the highlighted area.
·Drag the ends of the slider outwards to decrease the zoom, or drag the ends of the slider inwards to increase the zoom.
·The plot can be zoomed horizontally with the keyboard. To do this press 'UP' to zoom in, or press 'DOWN' to zoom out.
·The plot can be navigated horizontally with the mouse in two ways:
·Click and drag the horizontal slider left and right at the bottom of the plot view. Move the slider left to move the zoom back in time, or move the slider right to move forward in time.
·Click and drag the time axis values left and right. The current zoomed area will drag in the same direction as the mouse.
·The plot can be navigated horizontally with the keyboard. To do this press 'SHIFT + LEFT' to navigate back in time, or press 'SHIFT + RIGHT' to navigate forward in time.
Changing the Current Group
The current plot group can be changed, this is important for vertical zooming. When selecting a parameter, the group containing this parameter will become the selected group. Only the vertical scroll bar for the selected group will be visible.
·The current group can be selected with the mouse by clicking a parameter inside the group in the plot legend.
·The current group can be selected with the mouse by clicking inside the group's plot area (only in stacked display mode).
·The current group can be changed with the keyboard by pressing the 'PAGE UP' to move up through the groups, or 'PAGE DOWN' to move down through the groups.
Vertical Zooming and Navigation
Vertical zooming and navigation can be performed on the current group.
·The plot can be zoomed vertically by the mouse by dragging the ends of the slider outwards to decrease the zoom, or drag the ends of the slider inwards to increase the zoom.
·The plot can be zoomed vertically with the keyboard. To do this press the 'ALT + UP' to zoom in, or press the 'ALT + DOWN' to zoom out.
·The plot can be navigated vertically with the mouse in two ways:
·Click and drag the vertical slider up and down on the right of the plot area. Move the slider up to move the zoom area upwards, or move the slider down to move the zoom area downwards.
·Click and drag the y-axis values up and down. The current zoomed area will drag in the same direction as the mouse.
·The plot can be navigated vertically with the keyboard. To do this press 'SHIFT + UP' to navigate upwards, or press 'SHIFT + DOWN' arrow to navigate downwards.
Changing the Y-Axis Span - Overlapped Mode Only
The y-axis size and position can be changed for each group when in overlapped mode. This is important for overlaying groups.
·The size of the y-axis can be changed by clicking and dragging the end markers of the group y-axis slider. The slider is located on the right of the plot and the end markers are shown as small rectangles.
·The position of the y-axis can be changed by clicking and dragging the centre marker of the group y-axis slider. The slider is located on the right of the plot and the centre marker is shown as a small rectangle.
Other Features
·Right click on the plot to view a menu of zooming, navigation and mode functions. Included in this menu is access to the plot properties.
·The display mode can be toggled between stacked and overlapped by pressing the 'G' key.
See Also:
To change the display properties of the plot, right click and select 'Properties'. In the Properties window you will notice a 'Display' tab. Click on this to see the range of available display properties.
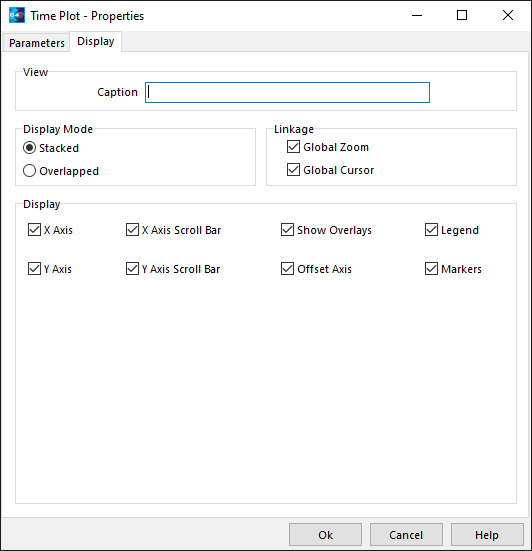
Display Options Setup
The following options exist, but are not configurable on every view type:
·Display Mode Stacked - Display mode stacked means the time plot will show a separate plot area for each group.
·Display Mode Overlapped - Display mode overlapped means that all parameters will share a plot area. The position and zoom of each group can be changed to overlap different parameters.
·Global Zoom - Enables and disables the view from sharing a common time range and zoom with other views.
·Global Cursor - Enables and disables the view from sharing a common cursor with other views.
·Y Axis Component - Shows or hides the y-axis.
·Y Axis Scroll Bar Component - Shows or hides the y-axis scroll bar.
·X Axis Component - Shows or hides the x-axis.
·X Axis Scroll Bar Component - Shows or hides the x-axis scroll bar.
·Legend - Shows or hides the parameter legend.
See Also: Log File Management for advanced use of the time plot.


